USDCAD Long - 1.26500USD CAD is trading near it's demand zone. Wait for Reversal of short term trend to take place. Once Doji/Inside Bar/Outside Bar appears , then go long for a comfortable swing high
Search in ideas for "INSIDE BAR"

TATA Consumer looks strong…TATA Consumer looks strong…
Reasons/Traits :
• Today gave a break out from two day inside bars with a big green bar with very good volume
• Above 13 and 50 EMA
• Price touched 0.618 retracements levels
• RSI increasing
• Bearish Crab harmonic pattern formation is in place
What can happen next :
Scenario 1 : Price sustaining above 850/853 levels can take it to 865/870/915/940 levels
Scenario 2 : Price break down below 834 can take it down to 812/800/775/750 levels
Disclaimer : This analysis is only for educational purpose and not be considered as any trading idea/tip. Please consult your financial advisor before you take any trade and we are no way responsible for your profits/losses. Thank you!
Please do like and share this idea. Thanks

Nifty Next Moves - Short Nfty Trade for Today & Tomorrow
Nifty has a false inside bar range break-out on Friday. A straightforward trade setup is
If it breaks Fridays low - pls note IF and only IF
There is a high chance that it will test the low of Mother bar of the range
Target and Stop loss provided on charts
Happpy Trading
MSK

Bank Nifty Future 1HourHi Friends
on Day level Bank Nifty has made indecisive candle.
We had inside bar in 1 Hour time frame today high and low important
as today Bank Nifty Future traded almost with in first 1 hour bar
I will focus on today high how it break tomorrow and 1 Hr Trend line . in last two 15 minute shown good break out with volume .

BANK NIFTY consecutive 2 inside bar and nr7it has strong support around 30800.
observing weekly chart there is no problem with it.
mother bar of 30th dec had low of 31007 if it breaks this level it can go down to 30800
Bias should be buy on dip.
if it breaks recent high one can go long.
but it seems to be certain this narrow range not going to last next week.
in hourly time frame it is not in over bought or in over sold condition.

REDINGTON3 Inside Bar and reduction in volatility by 57% compare to 1st weekly bar in 3 bars. It can be above 137 level with SL of 128.

Market Next Week - Mood is BEARISH SENSEX WEEKLY
1. On week of 27-July made a high of 38617 which is 78% of restracement and respected as resistance
2. On week of 03-Aug it has broken the lows of last 2 weeks and 3 bar candle suggesting weakness a good weakness in the market.
3. Good sign is that it is abave the EMA's and near upper BB
4. Next week market may fall taking support around EMA's & fibo cluster near 36000 - 35700
SENSEX DAILY
1. Inside Bar on 07-Aug, Levels to Watch - 38221 & 37756.
2. Breaching any one of these on Monday will give the direction to the market.
3. Other Possibilities on Monday is to form OB - which again give a room for sideways over the week.
4. If breaks low - will make short bias if breaks high will make long strategies.
5. No Divergence is present on daily
SENSEX 15 Min
1. Respecting 61% retracement, after giving BO showing sign of weakness
2. RSI divergence present and respecting resistance
OVERALL - Mood is BEARISH

NIFTY TRADE SETUP FOR THE WEEK -INDEX HAS MANAGED TO 11000 MARK ON A WEEKLY BASIS
-11247 IS A CRUCIAL LEVEL FOR THE INDEX
-ONCE THE LEVEL OF 11247 IS CONQUERED NEXT TARGET WOULD BE 11340-11410
-A CROSS ABOVE THAT WILL ALLOW INDEX TO TEST 11500
-MARKET IS GETTING INTO OVERBROUGHT POSTIONS IN SMALLER TIME-FRAME
-ON DAILY CHART RSI TOOK SUPPORT AT LEVELS OF 60 AND NOW IS TRADING AT 71
-INDICATING THAT ITS NOT WILLING TO GO DOWN
-INTEREST OBSERVATION DURING THIS PREVIOUS WEEK WAS INDEX IS TRADING INDEX THE BAR OF 22ND JULY
-INDICATING SOONER OR LATER WE WILL HAVE A INSIDE BAR BREAKOUT
-CRUCIAL SUPPORT PLACED AT 11035
-CRUCIAL RESISTANCE IS PLACED AT 11240
NIFTY RESISTANCE FOR THE DAY
11240-11342-11410
NIFTY SUPPORT FOR THE DAY
11125-11035-10980
!!PLEASE NOTE THE ABOVE INFORMATION IS FOR KNOWLEDGE ONLY!!
!!TRADE ACCORDING TO YOUR RISK PROFILE!!
!!SUGGEST OPTION TRADES TO NAVIGATE VOLATILITY!!
!!HAPPY TRADING!!

Momentum Analysis & Distribution Phase - Tata ChemicalsPrice Action Analysis:
Analysis of momentum is not about measuring any absolute value of momentum, but in making a comparison of current price action momentum with prior price action momentum. In the month of March price declined from a high of 340 to a low of 197. Price swings saw an acceleration and shows increasing momentum and strengthening of decline. From the low of 197 price reversed and advanced with higher swing lows and high swing highs to record a high at 325. But the price structure of the up move indicates a decelerating momentum. Decreasing slope (the violet line with) shows decreasing speed. Momentum within this price swing is decreasing, showing weakness developing in the price swing.
The swing high at 325 falls within the prior resistance zone of the 340. The present position of price appears to be in a distribution phase with the completion of five internal swings within a mother swing with a swing high at 325 and a swing low at 293, which is also visible as multiple inside bars on a weekly time frame.
Ranges that has formed at the end of a previous trend (uptrend) brings a balance in supply and demand of the market. In such ranges, neither buying nor selling activity will be large enough to create significant movement towards upside or downside. Hence in such type of ranges, Price action moves sideways for an extended time period. Big Institutional Players and Smart Money traders commonly referred as Composite Man by Wyckoff, take significantly large positions in these types of Ranges. One can witness low volumes as price entered the distribution phase but the volume has increased with significant bearish bars in the last leg of the swing.
Trade Plan:
One can initiate a short position in the zone of 300 to 306 with an Initial Stop-Loss of 323. Price can find initial support in the zone of 293. One can expect an equal measured move of the range on price break and close below the mother swing low at 293.
Disclaimer
All investments involve risk, and the past performance of a security, industry, sector, market, financial product, trading strategy, or individual’s trading does not guarantee future results or returns. Investors are fully responsible for any investment decisions they make. Such decisions should be based solely on an evaluation of their financial circumstances, investment objectives, risk tolerance, and liquidity needs.

Bank Nifty Weekly Technical Outlook - 04.07.2020Bank Nifty formed an inside bar on weekly time frame and closed at 21852. On Monday price formed a bullish pin bar which indicated price rejection at previous swing low at 20926. Price formed a bearish pivot point reversal pattern at the end of the week.
The weekly volatility is at 6.7. The probable weekly returns is of 1400 points from the weekly close, with a measured move in increments of 330 points. The key level of the existing trend is at 20926 and the critical level at 19507. The point of control for the upcoming week is in the zone of 21685. Price staying above the point of control and surpassing the initial resistance zone of 22015 can find minor resistance in the zone of 22344 and major resistance in the zone of 22609. Price breaking the point of control can find minor support at 21356 and major support at 21026. On price breaking the major support zone one can also witness a break of up trend line which puts the existing trend in danger. But one has to wait for a valid trend line break and price action near the key level at 20926 will be of utmost importance.
Disclaimer
All investments involve risk, and the past performance of a security, industry, sector, market, financial product, trading strategy, or individual’s trading does not guarantee future results or returns. Investors are fully responsible for any investment decisions they make. Such decisions should be based solely on an evaluation of their financial circumstances, investment objectives, risk tolerance, and liquidity needs.

[Positional] SAIL LONGBuy above 32.3 with Sl at 30.9
~ Inside bar trades are generally aimed to capture the compression effect i.e sharp breakouts. Profits are
taken quicky or trailed in most of the cases and closed before market close barring rare cases where price action analysis suggests otherwise.

BRITANNIA Inside Bar BreakoutBritannia formed doji candle on daily time frame and contracted within previous day's candle.
The high/low can be traded with a conservative target at the mother bar's high/low range.
Long above 3407
TGT: 3442
Short below 3344
TGT: 3306
NOTE: Trade with confirmation of momentum & volume on lower timeframes in intraday.


Rounding bottom - GlenmarkThe stock has formed a rounding bottom reversal pattern and had a breakout to upside. But it dint have a strong close above the breakout with good volumes.
But since an Inside bar pattern is witnessed at the end of this pattern, we can go go long above the bar extreme once it breakouts.
Entry - Above 547 based on bull signal in smaller time frame
SL - 537
T1 - 560
T2 - 565 to 570 depending on the momentum.
Purely for study purpose.
Thanks.

intellect design idea#INTELLECT Add to swing watchlist, Hourly timeframe
Inside bar setup active will be active only above 817
Resistance of 860
Can add on dips till 790
happy trading!!!
The stock's ratio of 45.06x is currently trading slightly above its industry peers' ratio of 41.27x, which means if you buy Intellect Design Arena today, you'd be paying a relatively sensible price for it.

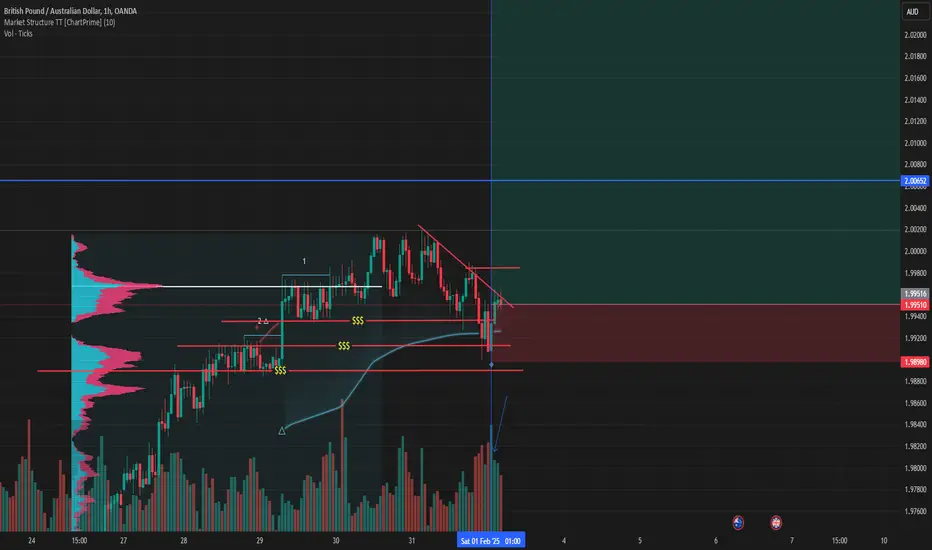
BUY GBPAUD 3/2/2025+ AB currency
+ D1 uptrend
+ H1 get liquidity + price return to GAP
+ H4 pattern inside bar
#SRF - Potential STAGE 1 Break Out (Multi Year Consolidation)📊 Script: SRF
Key highlights: 💡⚡
📈 STAGE 1 - Accumulation formation in Weekly chart.
📈 Price gave a good up move, then went Side Ways
📈 Multi year Price consolidation
📈 Multiple Inside Bars formed in Daily chart
📈 Enter on BO when spike in Volume is seen
📈 MACD Cross Over
📈 One can go for Swing Trade.
BUY ONLY ABOVE 2700 DCB
⏱️ C.M.P 📑💰- 2583
🟢 Target 🎯🏆 – NA%
⚠️ Stoploss ☠️🚫 – NA%
⚠️ Important: Always Exit the trade before any Event.
⚠️ Important: Always maintain your Risk & Reward Ratio.
✅Boost, Like and follow to never miss a new idea! ✅
Disclaimer: I am not SEBI Registered Advisor. My posts are purely for training and educational purposes.
Eat🍜 Sleep😴 TradingView📈 Repeat 🔁
Happy learning with MMT. Cheers!🥂

NIFTY key levels ahead of Union BudgetHi,
* Nifty key levels for coming days
* 21st Jan is a Mother candle (450points)
* Currently Inside Bar pattern is formed.
Whichever side breaks, we can expect 450 points rally in the coming days
Regards
Bull Man

Nifty intraday key levels for 15.01.25Hi,
* Please mark the levels in your chart and get prepared for Intraday Trading
* These Support and Resistance levels have good accuracy.
R1 23280 / 23310
S1 23100 / 23050
* Inside Bar pattern on 13.01.25. Mother candle range is 290 points.
* A Daily close above 23341 or below 23040, we might see movement of around 300 points
Regards
Bull Man

Nifty intraday key levels for 08.01.25Hi,
* Please mark the levels in your chart and get prepared for tomorrow
* These Support and Resistance levels have good accuracy.
R1 23870 / 23940
S1 23650 / 23530
* Inside Bar pattern on 20.12.24. Mother candle range is 528 points.
* A Daily close below 23530, might drag towards 23000 zone
* Below 23000 on daily closing basis, market will witness more weakness
Regards
Bull Man

ABC Correction1]Second wave retracing to the 0.68% Fibonacci level. In Elliot Wave Theory, the second wave is typically a corrective wave that retraces a significant portion of the first impulse wave. The 0.618 (61.8%) level is particularly significant, indicating a strong potential support or resistance zone & suggesting it’s near completion.
2]Completed ABC Correction: This is a common Elliott Wave pattern, representing a three-wave corrective structure labeled as ABC. It implies that the correction has potentially concluded, paving the way for the next impulse wave.
3]Mother Candle/Inside Bar is formation:
Breakout from the range defined by the mother candle as an entry point.

Nifty intraday key levels for 30.12.24Hi,
* Please mark the levels in your chart and get prepared for tomorrow
* These Support and Resistance levels have good accuracy.
S1 23650 / 23530
R1 23870 / 23940
* Inside Bar pattern on 20.12.24. Mother candle range is 528 points.
* A Daily close below 23530, might drag downside 23000 zone
* Below 23000 on daily closing basis, market will witness more weakness
Regards
Bull Man

Bank Nifty intraday key levels for 30.12.24Hi,
* Please mark the levels in your chart and get prepared for tomorrow
* These Support and Resistance levels have good accuracy.
S1 50870 / 50800
R1 51400 / 51440
* Inside Bar pattern on 20.12.24. Mother candle range is 1020 points.
* Multiple rejections at Mother candle high around 51693 - 51740
* A Daily close below 50600, might drag downside 49780-49600 zone
* Below 49600 on daily closing basis, market will witness more weakness
Regards
Bull Man
